
Pickleball Courts by State: 2026 U.S. Infrastructure Index
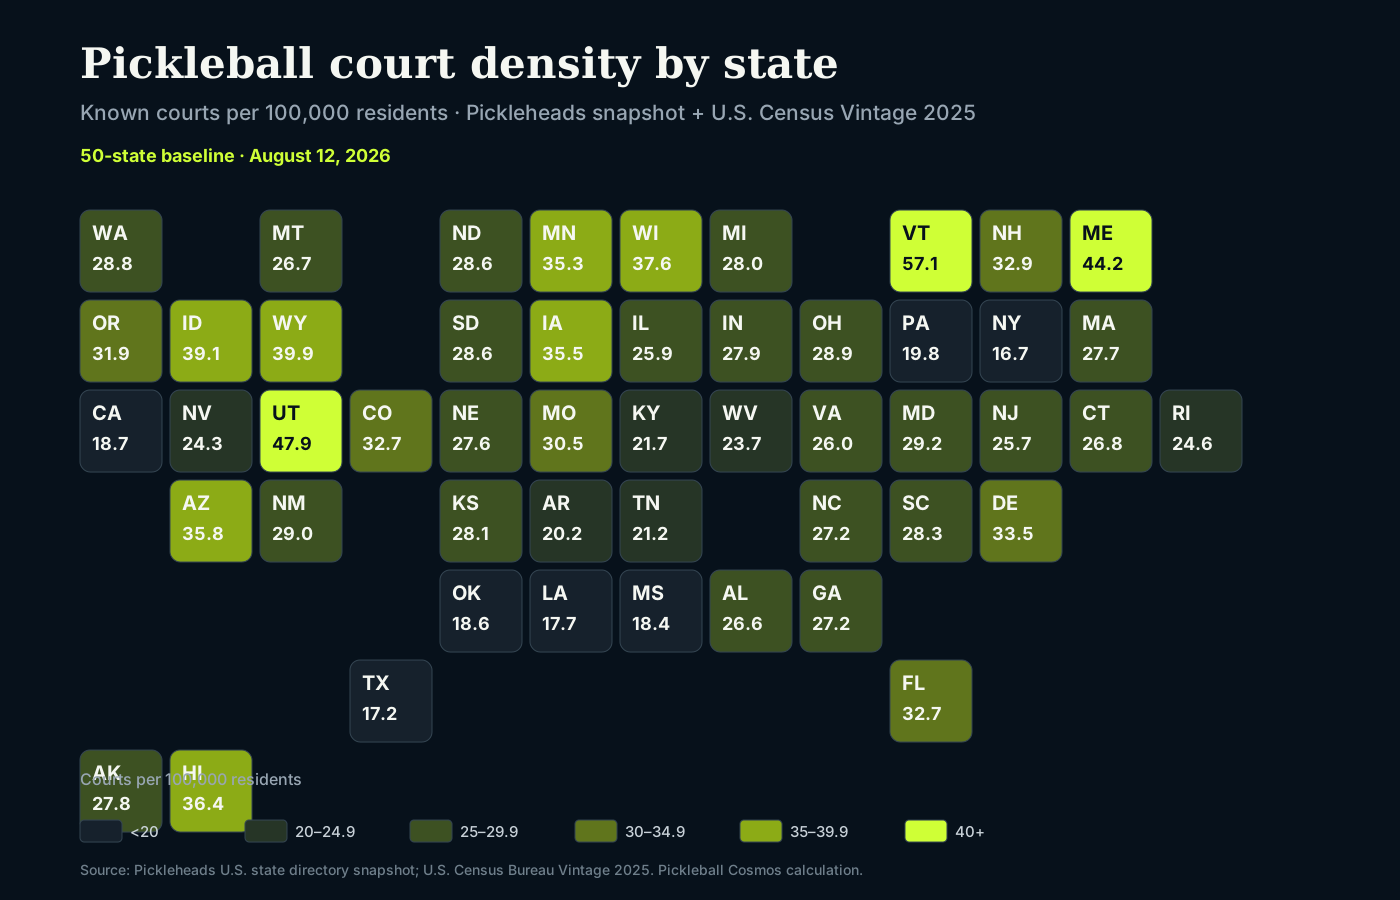
Florida has the most courts in the state directory. Vermont has the most per resident. The difference between those rankings shows why raw court totals alone are a poor measure of local infrastructure density.
What this index measures
Pickleball Cosmos combined a dated snapshot of the Pickleheads U.S. state directory with the U.S. Census Bureau's Vintage 2025 resident population estimates. For each of the 50 states we calculated courts per 100,000 residents, locations per 100,000 residents and courts per listed location. The underlying snapshot remains August 12, 2026; this page was editorially reviewed August 21, 2026.
This is an infrastructure-density index, not a demand ranking. It does not tell us how many people in each state play pickleball, how busy the courts are, or how many additional courts a state needs.
Dataset record
| Dataset | Pickleball Cosmos U.S. Court Infrastructure Database — 2026 Baseline |
| Identifier | PC-US-COURTS-2026-V1 |
| Version | 2026.1 |
| Court-directory snapshot | August 12, 2026 |
| Population reference date | July 1, 2025 |
| Geographic scope | 50 U.S. states; D.C. and territories excluded from rankings |
| Rows | 50 |
| Distribution | CSV — cleaned 50-state dataset |
| Metadata | JSON — provenance and field definitions |
The cleaned dataset contains Pickleball Cosmos calculations derived from third-party source inputs. No open-data license is implied for the underlying Pickleheads directory data; source rights remain with their respective publishers.
The states with the most listed pickleball courts
| State | Courts | Locations | Courts / 100k | Per-capita rank |
|---|---|---|---|---|
| Florida | 7,674 | 1,485 | 32.7 | 14 |
| California | 7,355 | 1,458 | 18.7 | 45 |
| Texas | 5,441 | 1,188 | 17.2 | 49 |
| Ohio | 3,434 | 734 | 28.9 | 19 |
| New York | 3,332 | 830 | 16.7 | 50 |
| Illinois | 3,294 | 754 | 25.9 | 36 |
| Georgia | 3,075 | 586 | 27.2 | 30 |
| North Carolina | 3,042 | 698 | 27.2 | 31 |
| Michigan | 2,835 | 607 | 28.0 | 25 |
| Arizona | 2,727 | 441 | 35.8 | 8 |
Florida and California dominate the absolute count, with 7,674 and 7,355 listed courts respectively. Texas is third at 5,441. But population changes the interpretation substantially: California ranks 45th and Texas 49th in courts per 100,000 residents.
The states with the most courts per 100,000 residents
| State | Courts / 100k | Courts | Total-court rank |
|---|---|---|---|
| Vermont | 57.1 | 368 | 43 |
| Utah | 47.9 | 1,694 | 22 |
| Maine | 44.2 | 626 | 36 |
| Wyoming | 39.9 | 235 | 48 |
| Idaho | 39.1 | 793 | 33 |
| Wisconsin | 37.6 | 2,244 | 15 |
| Hawaii | 36.4 | 522 | 40 |
| Arizona | 35.8 | 2,727 | 10 |
| Iowa | 35.4 | 1,148 | 27 |
| Minnesota | 35.3 | 2,057 | 16 |
Vermont's 368 listed courts are modest in absolute terms, but its population is about 645,000. That produces 57.1 courts per 100,000 residents — more than double the 50-state aggregate rate of approximately 25.5.
Utah ranks second at 47.9, followed by Maine at 44.2, Wyoming at 39.9 and Idaho at 39.1. These states do not necessarily have the largest pickleball markets; they have the highest listed court density relative to resident population in this dataset.
The biggest rank reversals
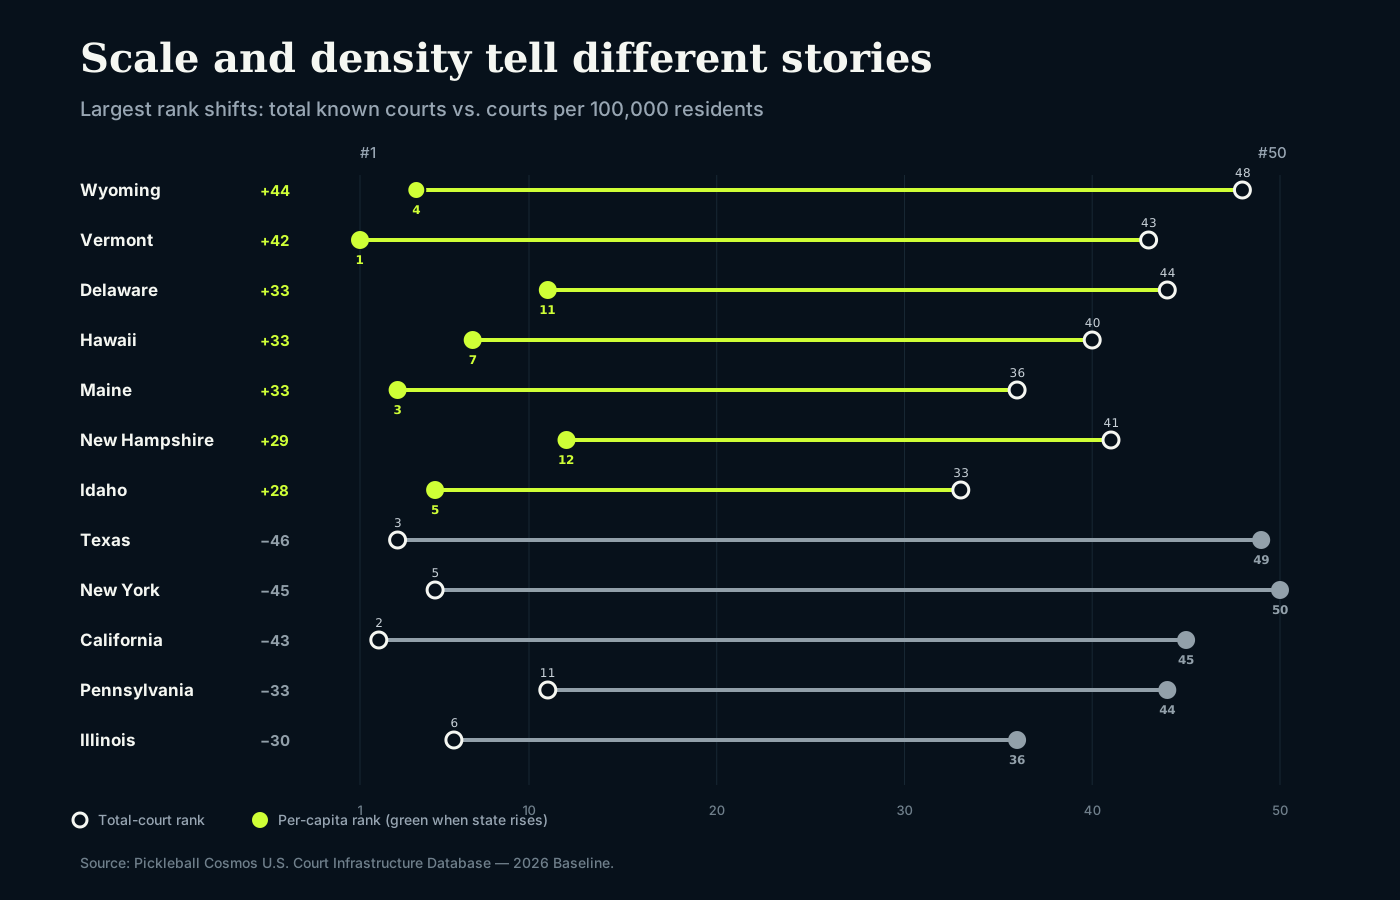
Large states naturally accumulate more facilities, so absolute rank and per-capita rank can tell very different stories.
| State | Total-court rank | Per-capita rank | Shift after population adjustment |
|---|---|---|---|
| Texas | 3 | 49 | −46 places |
| New York | 5 | 50 | −45 places |
| Wyoming | 48 | 4 | +44 places |
| California | 2 | 45 | −43 places |
| Vermont | 43 | 1 | +42 places |
| Delaware | 44 | 11 | +33 places |
| Maine | 36 | 3 | +33 places |
| Hawaii | 40 | 7 | +33 places |
The reversal is useful because it separates market scale from infrastructure density. Neither metric is inherently better; they answer different questions.
Facility concentration adds another dimension
The 50-state snapshot contains 87,121 courts across 18,959 listed locations, or about 4.6 courts per location. Arizona has the highest courts-per-location ratio among the states at about 6.2, followed by New Jersey at 5.6, Nevada and Utah at about 5.4, and Georgia at 5.2.
That measure should be read cautiously. A high ratio can reflect larger multi-court facilities, but directory definitions, temporary lines and how facilities are entered can also affect the count.
All 50 states ranked by courts per capita
| Rank | State | Courts | Locations | 2025 population | Courts / 100k | Locations / 100k | Courts / location | Total-court rank |
|---|---|---|---|---|---|---|---|---|
| 1 | Vermont | 368 | 102 | 644,663 | 57.1 | 15.8 | 3.6 | 43 |
| 2 | Utah | 1,694 | 313 | 3,538,904 | 47.9 | 8.8 | 5.4 | 22 |
| 3 | Maine | 626 | 172 | 1,414,874 | 44.2 | 12.2 | 3.6 | 36 |
| 4 | Wyoming | 235 | 55 | 588,753 | 39.9 | 9.3 | 4.3 | 48 |
| 5 | Idaho | 793 | 182 | 2,029,733 | 39.1 | 9.0 | 4.4 | 33 |
| 6 | Wisconsin | 2,244 | 518 | 5,972,787 | 37.6 | 8.7 | 4.3 | 15 |
| 7 | Hawaii | 522 | 161 | 1,432,820 | 36.4 | 11.2 | 3.2 | 40 |
| 8 | Arizona | 2,727 | 441 | 7,623,818 | 35.8 | 5.8 | 6.2 | 10 |
| 9 | Iowa | 1,148 | 292 | 3,238,387 | 35.4 | 9.0 | 3.9 | 27 |
| 10 | Minnesota | 2,057 | 456 | 5,830,405 | 35.3 | 7.8 | 4.5 | 16 |
| 11 | Delaware | 355 | 78 | 1,059,952 | 33.5 | 7.4 | 4.6 | 44 |
| 12 | New Hampshire | 466 | 118 | 1,415,342 | 32.9 | 8.3 | 3.9 | 41 |
| 13 | Colorado | 1,968 | 414 | 6,012,561 | 32.7 | 6.9 | 4.8 | 18 |
| 14 | Florida | 7,674 | 1,485 | 23,462,518 | 32.7 | 6.3 | 5.2 | 1 |
| 15 | Oregon | 1,363 | 306 | 4,273,586 | 31.9 | 7.2 | 4.5 | 26 |
| 16 | Missouri | 1,912 | 435 | 6,270,541 | 30.5 | 6.9 | 4.4 | 20 |
| 17 | Maryland | 1,828 | 420 | 6,265,347 | 29.2 | 6.7 | 4.4 | 21 |
| 18 | New Mexico | 617 | 133 | 2,125,498 | 29.0 | 6.3 | 4.6 | 37 |
| 19 | Ohio | 3,434 | 734 | 11,900,510 | 28.9 | 6.2 | 4.7 | 4 |
| 20 | Washington | 2,303 | 561 | 8,001,020 | 28.8 | 7.0 | 4.1 | 14 |
| 21 | North Dakota | 229 | 59 | 799,358 | 28.6 | 7.4 | 3.9 | 49 |
| 22 | South Dakota | 267 | 66 | 935,094 | 28.6 | 7.1 | 4.0 | 47 |
| 23 | South Carolina | 1,576 | 324 | 5,570,274 | 28.3 | 5.8 | 4.9 | 23 |
| 24 | Kansas | 838 | 206 | 2,977,220 | 28.2 | 6.9 | 4.1 | 30 |
| 25 | Michigan | 2,835 | 607 | 10,127,884 | 28.0 | 6.0 | 4.7 | 9 |
| 26 | Indiana | 1,944 | 425 | 6,973,333 | 27.9 | 6.1 | 4.6 | 19 |
| 27 | Alaska | 205 | 53 | 737,270 | 27.8 | 7.2 | 3.9 | 50 |
| 28 | Massachusetts | 1,983 | 447 | 7,154,084 | 27.7 | 6.2 | 4.4 | 17 |
| 29 | Nebraska | 558 | 148 | 2,018,006 | 27.7 | 7.3 | 3.8 | 38 |
| 30 | Georgia | 3,075 | 586 | 11,302,748 | 27.2 | 5.2 | 5.2 | 7 |
| 31 | North Carolina | 3,042 | 698 | 11,197,968 | 27.2 | 6.2 | 4.4 | 8 |
| 32 | Connecticut | 989 | 231 | 3,688,496 | 26.8 | 6.3 | 4.3 | 29 |
| 33 | Montana | 306 | 82 | 1,144,694 | 26.7 | 7.2 | 3.7 | 45 |
| 34 | Alabama | 1,381 | 279 | 5,193,088 | 26.6 | 5.4 | 4.9 | 25 |
| 35 | Virginia | 2,304 | 562 | 8,880,107 | 25.9 | 6.3 | 4.1 | 13 |
| 36 | Illinois | 3,294 | 754 | 12,719,141 | 25.9 | 5.9 | 4.4 | 6 |
| 37 | New Jersey | 2,453 | 441 | 9,548,215 | 25.7 | 4.6 | 5.6 | 12 |
| 38 | Rhode Island | 274 | 65 | 1,114,521 | 24.6 | 5.8 | 4.2 | 46 |
| 39 | Nevada | 797 | 147 | 3,282,188 | 24.3 | 4.5 | 5.4 | 32 |
| 40 | West Virginia | 418 | 93 | 1,766,147 | 23.7 | 5.3 | 4.5 | 42 |
| 41 | Kentucky | 1,001 | 227 | 4,606,864 | 21.7 | 4.9 | 4.4 | 28 |
| 42 | Tennessee | 1,549 | 351 | 7,315,076 | 21.2 | 4.8 | 4.4 | 24 |
| 43 | Arkansas | 630 | 139 | 3,114,791 | 20.2 | 4.5 | 4.5 | 35 |
| 44 | Pennsylvania | 2,586 | 628 | 13,059,432 | 19.8 | 4.8 | 4.1 | 11 |
| 45 | California | 7,355 | 1,458 | 39,355,309 | 18.7 | 3.7 | 5.0 | 2 |
| 46 | Oklahoma | 766 | 192 | 4,123,288 | 18.6 | 4.7 | 4.0 | 34 |
| 47 | Mississippi | 543 | 123 | 2,954,160 | 18.4 | 4.2 | 4.4 | 39 |
| 48 | Louisiana | 816 | 174 | 4,618,189 | 17.7 | 3.8 | 4.7 | 31 |
| 49 | Texas | 5,441 | 1,188 | 31,709,821 | 17.2 | 3.7 | 4.6 | 3 |
| 50 | New York | 3,332 | 830 | 20,002,427 | 16.7 | 4.1 | 4.0 | 5 |
Why our total does not match every national court number you may see
The public Pickleheads state directory is a live, changing database. Summing the 50 canonical state rows in our August 12 snapshot produces 87,121 courts and 18,959 locations. USA Pickleball's 2025 Annual Growth Report, published earlier in 2026, reported 82,613 known courts across 18,258 locations in the Pickleheads database.
Those figures are snapshots from different dates of a database that continues to add and revise records. More importantly, Pickleheads exposes other public aggregate surfaces whose totals do not reconcile cleanly with the state directory. For that reason, this index does not present our 50-state sum as an official national court census. We use one internally consistent state-directory snapshot for state-to-state comparison.
We found taxonomy anomalies — and did not hide them
The raw U.S. directory snapshot included separate rows labeled CA (7 courts), MI (4 courts) and NC (2 courts), in addition to the full state-name rows. It also included District of Columbia, Puerto Rico, Virgin Islands and a row labeled “United States.”
We did not merge the abbreviated rows into California, Michigan or North Carolina because the public directory does not establish whether those records are unique facilities or duplicate classifications. Merging them could double-count. Instead, the 50-state ranking uses only the canonical full-name state rows. The untouched raw snapshot is preserved in the Pickleball Cosmos research archive.
Methodology
Court and location counts: Pickleheads public U.S. state directory, retrieved August 12, 2026. Pickleheads describes itself as the official court and game finder of USA Pickleball and says court information is reviewed before updates go live.
Population: U.S. Census Bureau Vintage 2025 estimates for July 1, 2025. Vintage 2025 is the Census Bureau's most recent completed, internally consistent state population series.
Calculations: Pickleball Cosmos. Courts per 100,000 = courts ÷ population × 100,000. Locations per 100,000 uses the same denominator. Courts per location = courts ÷ listed locations. Rankings are descending, with rank 1 representing the highest value.
Geographic scope: the 50 states. District of Columbia and U.S. territories are excluded from state rankings. Population totals used for the aggregate rate therefore also exclude D.C. and Puerto Rico.
Limitations
- This is not a census of every playable court. Directory coverage can be incomplete and changes over time.
- A “court” is not necessarily a dedicated public pickleball court. Listings can include facilities with temporary or shared use.
- Per-capita infrastructure is not demand. A low court-per-capita figure does not prove a state is underserved.
- Population is resident population. Tourism and seasonal populations can matter substantially in states such as Florida, Arizona and Hawaii.
- State averages hide local variation. A state can have high overall density and still contain metros or rural areas with limited access.
How to cite this dataset
Suggested citation: Pickleball Cosmos Editorial. Pickleball Cosmos U.S. Court Infrastructure Database — 2026 Baseline, version 2026.1. Pickleball Cosmos, August 12, 2026.
Canonical dataset landing page →
For journalists: attribution to Pickleball Cosmos is appropriate for the rankings, per-capita calculations and analysis. Please also preserve the underlying source context: court/location inputs are from the dated Pickleheads directory snapshot; population inputs are Census Vintage 2025. Do not describe 87,121 as an official census of all U.S. pickleball courts.
Press and research assets
- Cleaned 50-state dataset — CSV
- Dataset metadata and field definitions — JSON
- U.S. court-density tile map — SVG
- Total-rank vs per-capita rank shifts — SVG
SVG graphics are vector files suitable for publication-scale export. When reproducing a chart, retain the source line and Pickleball Cosmos attribution shown in the asset.
Primary sources and data
- Pickleheads — U.S. state court directory
- USA Pickleball — 2025 Annual Growth Report
- U.S. Census Bureau — Vintage 2025 National and State Population Estimates
- Pickleball Cosmos — cleaned 50-state dataset (CSV)
Court-directory snapshot retrieved August 12, 2026. Census population estimates are for July 1, 2025. Pickleball Cosmos calculations are rounded for presentation; the downloadable dataset retains the calculated fields used for the rankings.
Dataset use terms: citation, sharing and source-rights guidance →
Why more courts also creates a siting problem: the pickleball-noise planning analysis →